Ongoing research in the lab focusses on a mix of snow and ice and currently falls into three broad categories Changing Arctic Ice and Snow, Temperate Region Lake Ice, and Northern Hydrology
With the warming temperatures and reduced sea ice extent in the Arctic, examining the response of snow and ice to climate conditions is extremely timely and can provide insight on what changes may be yet to come. A mix of ground-based, satellite-based and model-based data is used for this research.
Lake Ice:
I have begun a High Arctic lake ice monitoring program to obtain validation data through ground-based observations and currently have cameras in place on 7 High Arctic lakes with planned expansion in the coming years. Recent field work has shown ~ 50 cm loss of thickness between 1980 and 2019 on one of the study lakes in Resolute, NU. Ongoing modelling work for lakes near Resolute, NU as well as Lake Hazen (Ellesemere Island, NU) suggest changes to both the duration and thickenss of the ice cover over the last ~ 30 years.
High Arctic lake ice phenology dates

Sea ice and snow:
Recent work in this area has been published in the journal Arctic Science (https://doi.org/10.1139/AS-2020-0024) with a 'zoomed-out' Pan-Arctic version nearly ready for publication. Within the overall warming and loss of snow and ice, regional trends are evident with some areas experiencing profound snow and ice loss, and others retaining the snow and ice longer. An example from the Canadian Arctic Archipelago shows the regionality quite well:

Graphical Abstract from: https://doi.org/10.1139/AS-2020-0024
Snow cover variability has also been monitored through collaborative work ( with Prof. Kathy Young and Claude Labine ) at Nanuit Itillinga (former Polar Bear Bass, NU), and how snow cover responds to the seasonal variations. The following example shows both the snow on and snow melt seasons for Bathurst and Cornwallis Islands for various years to highlight the seasonal variability.

Fig.8. Spatial pattern of snow cover extent across Bathurst Island and Cornwallis Island over the study years using MODIS products. (a) Documents the timing and extent of fall snowfall, and (b) illustrates the timing and extent of the snow cover during the snowmelt season. A small square indicates the general location of PBP. Source: doi:10.1139/AS-2017-0016
Our temperate region study site is located in the Haliburton Forest and Wild Life Reserve in Central Ontario.
Central Ontario lake ice phenology dates
The major research questions that we are looking to answer with our research at Haliburton Forest are, i) what are the effects of seasonal hydrology on lake ice thickness? ii) what are the effects of seasonal energy balance and climate on ice cover? And iii) how does the prevailing seasonal weather affect the ice formation? This ties into a larger research objective within our lab, which is to better understand the latitudinal differences in lake ice across Canada. This will allow for better parametrization of the Canadian Lake Ice Model, which is important for ice monitoring and developing a better understanding of ice types within Canada.
These questions are important because of the change in climate being observed in Canada. Long-term temperature trends indicate warming across the country from Central Ontario to northern Arctic latitudes. These changes in temperature will have a direct impact on the duration of ice cover in these areas but also on the types of ice and total ice thickness that is observed. Therefore, it is important to understand the differences in ice observed across Canada and develop a better understanding of how changes in climate will impact lake ice on both local and broad scales. Of particular importance is safety in respect to winter recreation as thinning ice cover is expected as the climate continues to change. Improving the overall understanding of lake ice within areas of Canada such as Central Ontario through the use of numerical models allows for improved decision making regarding winter tourism and recreational safety
Our previous work here was the first to use RADARSAT-2 to monitor ice phenology in the temperate regions and highlight the mid-winter thaws that often occur in this climate region.
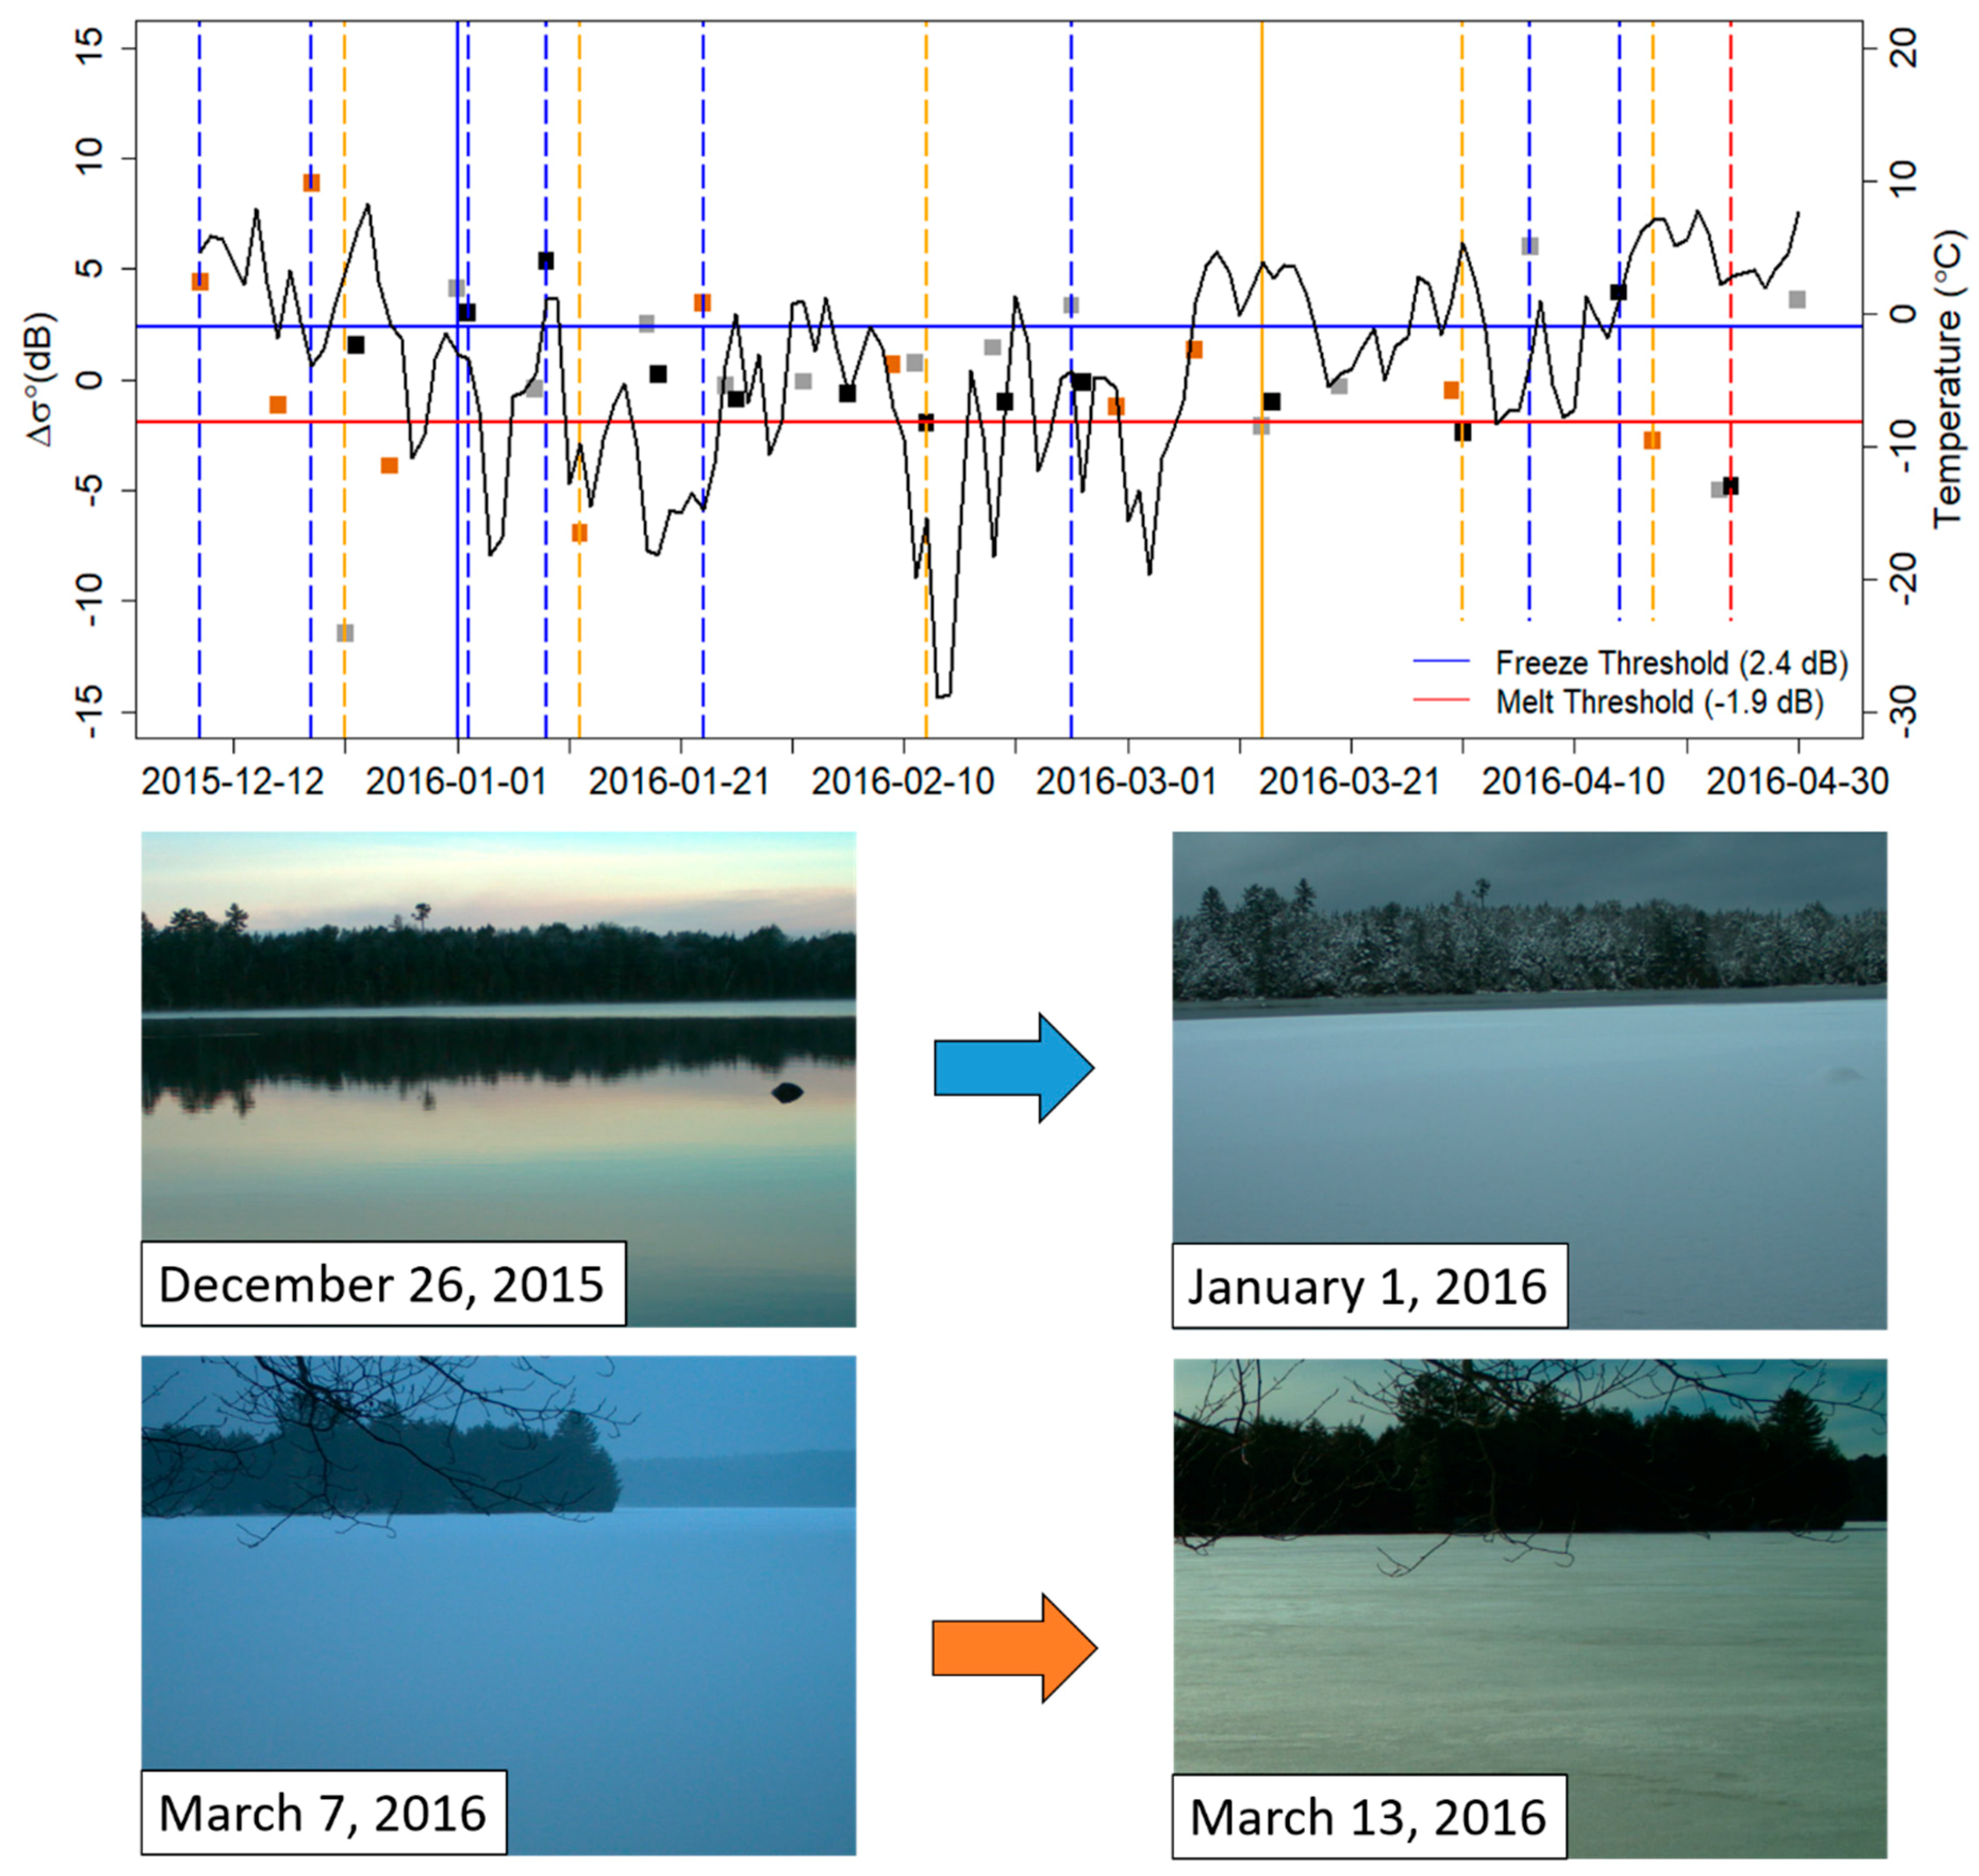
Figure 4. Mean backscatter difference (Δσ°, dB) evolution and temperature (black line) for MacDonald Lake during the 2016 ice season. The orange squares represent Δσ° values where the images had similar acquisition times (AM/AM or PM/PM), the grey squares represent Δσ° values where differences were calculated AM to PM, and the black squares represent Δσ° values where differences were calculated from PM to AM. The blue solid line shows a freeze event identified by the threshold on 1 January 2016 associated with the camera image below. The orange solid line shows a melt event identified by the threshold on 13 March 2016 associated with the camera image below. The additional dotted lines (blue for freeze events, orange for melt events, and red for WCI) represent the multiple events captured for this lake during the 2015/2016 ice season. Source: doi: 10.3390/rs10101641
We also looked into the composition of the ice column with respect to ice types, and focussed in on the effects of the white ice on the overall ice thickness, as the top layer of white ice tends to dominate the ice cover the study region. This white ice is formed in two ways 1) from the traditional mechanism of lake water flooding the ice and snow surface and refreezing and 2) from meltwater and rainwater during mid winter thaws refreezing on top of the ice. Detailed field work has been (and continues to be) done at this site allowing for a detailed comparison between the climate and ice conditions occurring each season. Using this information, modificiation have been made to the Canadian Lake Ice Model (CLIMo) to better represent the reflective properties of the temperature region ice, compared to the Arctic ice used for the model development. This has recently led to greatly improved model simulations for the temperate region.
Fig 7. Ice block (42 cm) extracted from MacDonald Lake in Central Ontario. The stratification of the ice layer with top forming white ice (snow ice) and bottom growing clear ice is visible (left) with tubular bubbles present (centre) and zoom in on the bottom surface (right). Source: https://doi.org/10.1371/journal.pone.0208519

Temperature and snow depth on shore at the MacDonald Lake automated weather station (AWS) [Missing AWS data from November 19 to December 6 and December 10 to December 16, 2016, were filled with Environment Canada data from the Haliburton 3, ON tower as indicated by dashed black line for temperature and darker grey bars for snow depth]. Rainfall total and 1981–2010 temperature normal are from Haliburton 3 tower. Also shown is average measured lake ice thickness for MacDonald and Clear Lakes, along with daily ice thickness recorded by the SWIP for three seasons. Modified/updated from: https://onlinelibrary.wiley.com/doi/abs/10.1002/hyp.13481

MacDonald and Clear Lake in Haliburton Forest lake ice modelling for three consecutive seasons; unadjusted model (red line), adjusted model (thick blue line), compared to observed ice thickness measurements and the Shallow Water Ice Profiler (SWIP, black line), and manual auger measurements (M-1: MacDonald Lake transect, middle of lake; M-2: MacDonald Lake, over the SWIP; C-1: Clear Lake, middle of Lake and C-2: Clear Lake, sheltered bay).
This collaborative research is mainly related to the Northern Research Basins working group (I do not supervise graduate research in this area). Recent work undertaken has focussed on comparing streamflow between large northern basins (Mackenzie, Yenisei) and examining recent variability in summer low flows and their relationship to jet stream variability between two subarctic basins. Some examples:

Figure 6: Amalgamation of flow in large river systems as shown by the 2003 daily discharge of rivers in (a) the Mackenzie Basin from Peace River at Hudson Hope to Artic Red River, (b) the Yenisei Basin from Kyzyl to Igarka Source: https://doi.org/10.2166/nh.2018.199.

Figure 2: Most frequent position of the jet stream during a) July and b) August from 2014 to 2018, relative to the long-term monthly mean jet stream position averaged from 1981 to 2010. Source: Thorne R, Woo MK, Brown LC. 2019. Recent summer low flows in two subarctic basins in Canada. 22nd International Northern Research Basins Symposium and Workshop, Yellowknife, Canada, 18-24 August, 2019

Figure 6: Combined total shortage (mm) for months of July and August across the western and eastern regions of the subarctic Source: Thorne R, Woo MK, Brown LC. 2019. Recent summer low flows in two subarctic basins in Canada. 22nd International Northern Research Basins Symposium and Workshop, Yellowknife, Canada, 18-24 August, 2019
Return to top of page